
Why Do Some Model Maker Sets Have Two Numbers?
___
If you've ever owned or seen Samsonite Model Maker sets from the late 1960's, you may have noticed there is an alternative number featured in the top left corner. These are some examples:
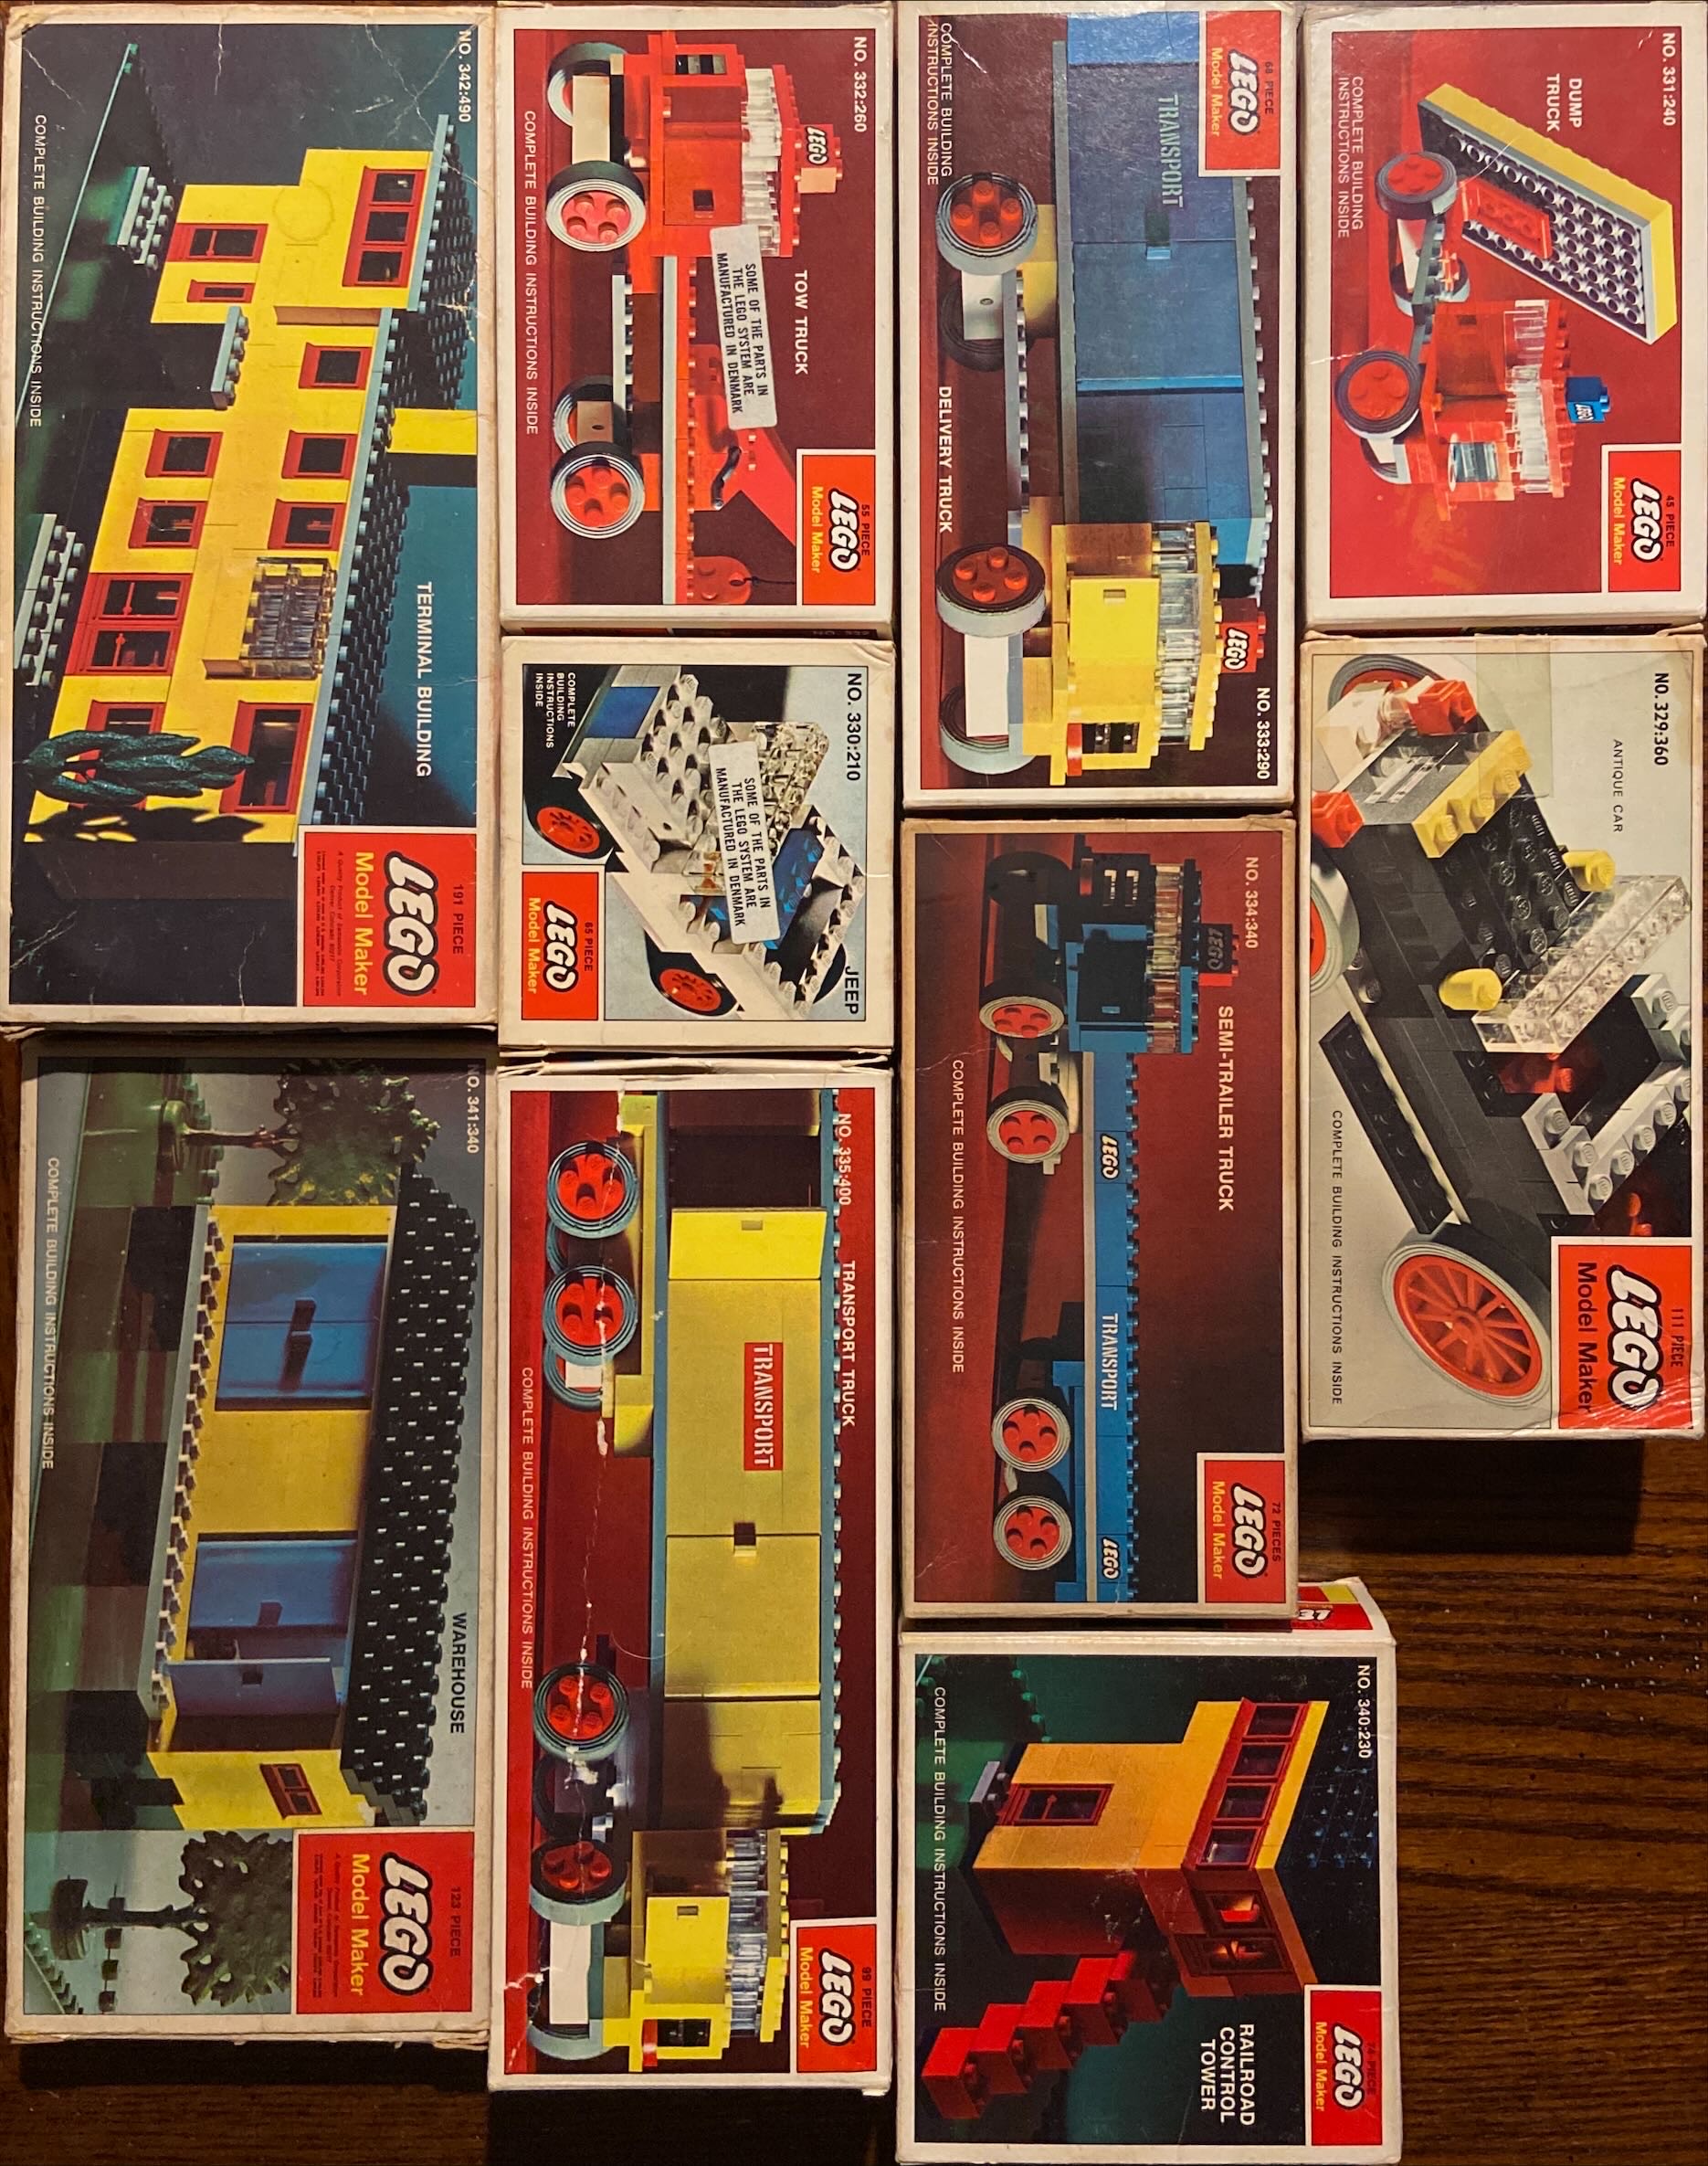
While I never thought much of it originally, I came across a forum post where others were openly wondering about it(here if you're interested, a really great collection and is worth a browse). And you know, now I'm kind of curious myself.
Different from some of the other mysteries we've explored, there is not one source I can dredge out to answer this question. It'll be much like the 022 Doll Furniture, in that we don't have sources to work with, but that doesn't mean we're stuck without recourse.
I've been able to effectively figure it out.
Beginnings
Taking some inspiration from the 022 Doll Furniture's article, as we had no leads in that case as well, my first thought was to compare all the sets and their boxes. Can't solve a mystery in a vacuum after all.
One of the first things I noticed was that the secondary number is only present on tabbed boxes(with exceptions). Any Model Maker boxes with drawers(released in North America in 1967) OR released in 1970(take the 346 Jumbo Jet or 157 Auto Transport for example) do not feature this number. As far as I can reckon, only sets that were released in 1968 or were later updated and given a tabbed box feature this number. From the above, it seems this practice was only active from 1968-1969.
Why are 1970 release sets missing the number? I'm not sure. They're both North American exclusives, so there's a possible connection(or exemption, if the number is European related) to make there.
The 315 European Taxie (a drawer set available starting 1967) does not have a tabbed counterpart that I can find, so I don't know what its number would be. It'll be excluded from this investigation at this point.
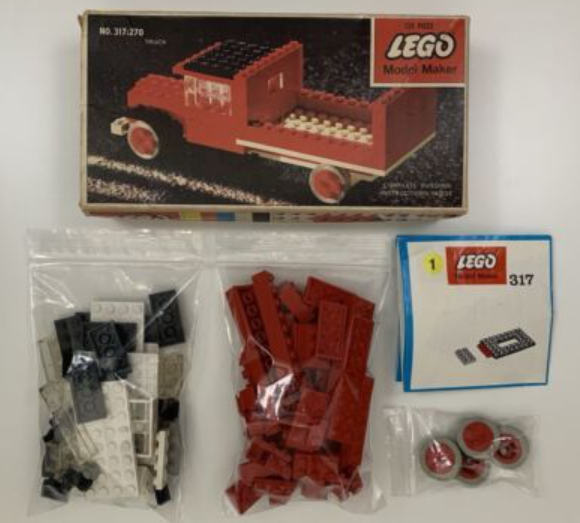
As I don't have examples of the updated boxes for the 316, 317, 319, or 320 sets on hand, I decided to write down the sets we had to work with. To organize better, I've put the list in ascending order with respect to the mystery second number.
Here are all the sets as I first recorded them:
Farm Tractor - 316:160 (tabbed) - 49 pieces

Truck With Trailer - 319:200 (tabbed) - 74 pieces

Jeep - 330:210 (tabbed) - 65 pieces

Railroad Control Tower - 340:230 (tabbed) - 74 pieces

Dump Truck - 331:240 (tabbed) - 45 pieces

Tow Truck - 332:260 (tabbed) - 55 pieces

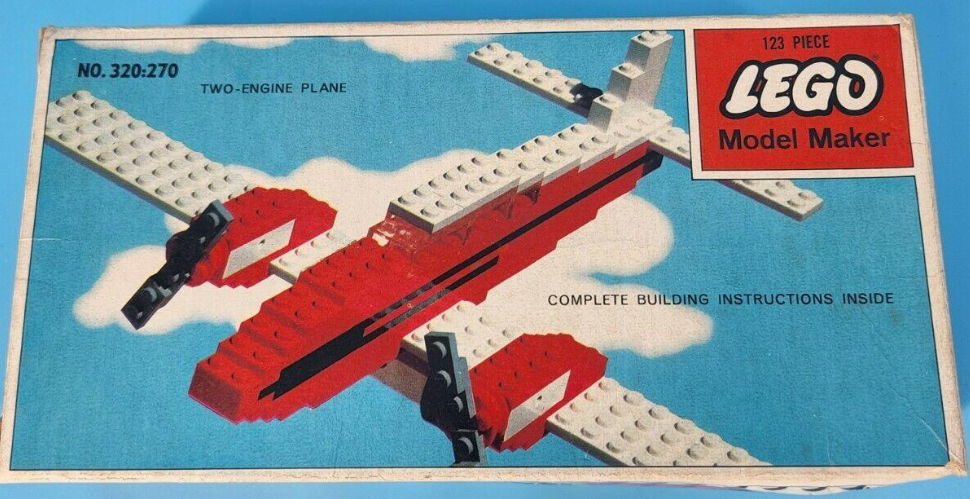
Two-Engine Plane - 320:270 (tabbed) - 123 pieces
Truck - 317:270 (tabbed) - 124 pieces
Delivery Truck - 333:290 (tabbed) - 68 piece

Semi-Trailer Truck - 334:340 (tabbed) - 72 pieces

Warehouse - 341:340 (tabbed) - 123 pieces

Antique Car - 329:360 (tabbed) - 111 pieces

Transport Truck - 335:400 (tabbed) - 99 pieces

Terminal Building - 342:490 (tabbed) - 191 pieces

Train Ferry - 343:530 (tabbed) - 147 pieces
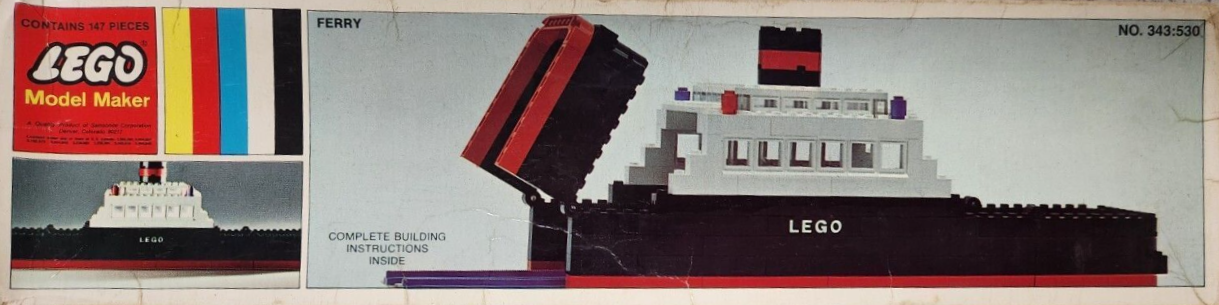
First thing of note, while the set numbers are all jumbled around now, the smallest set boxes are lower on the list than the higher numbers, which follow set box size fairly well. I've taken a picture to show you what I mean, note that this is not comprehensive as I'm missing the 343 Train Ferry set and the 316 Tractor(as I didn't know about that set's tabbed variant until later):
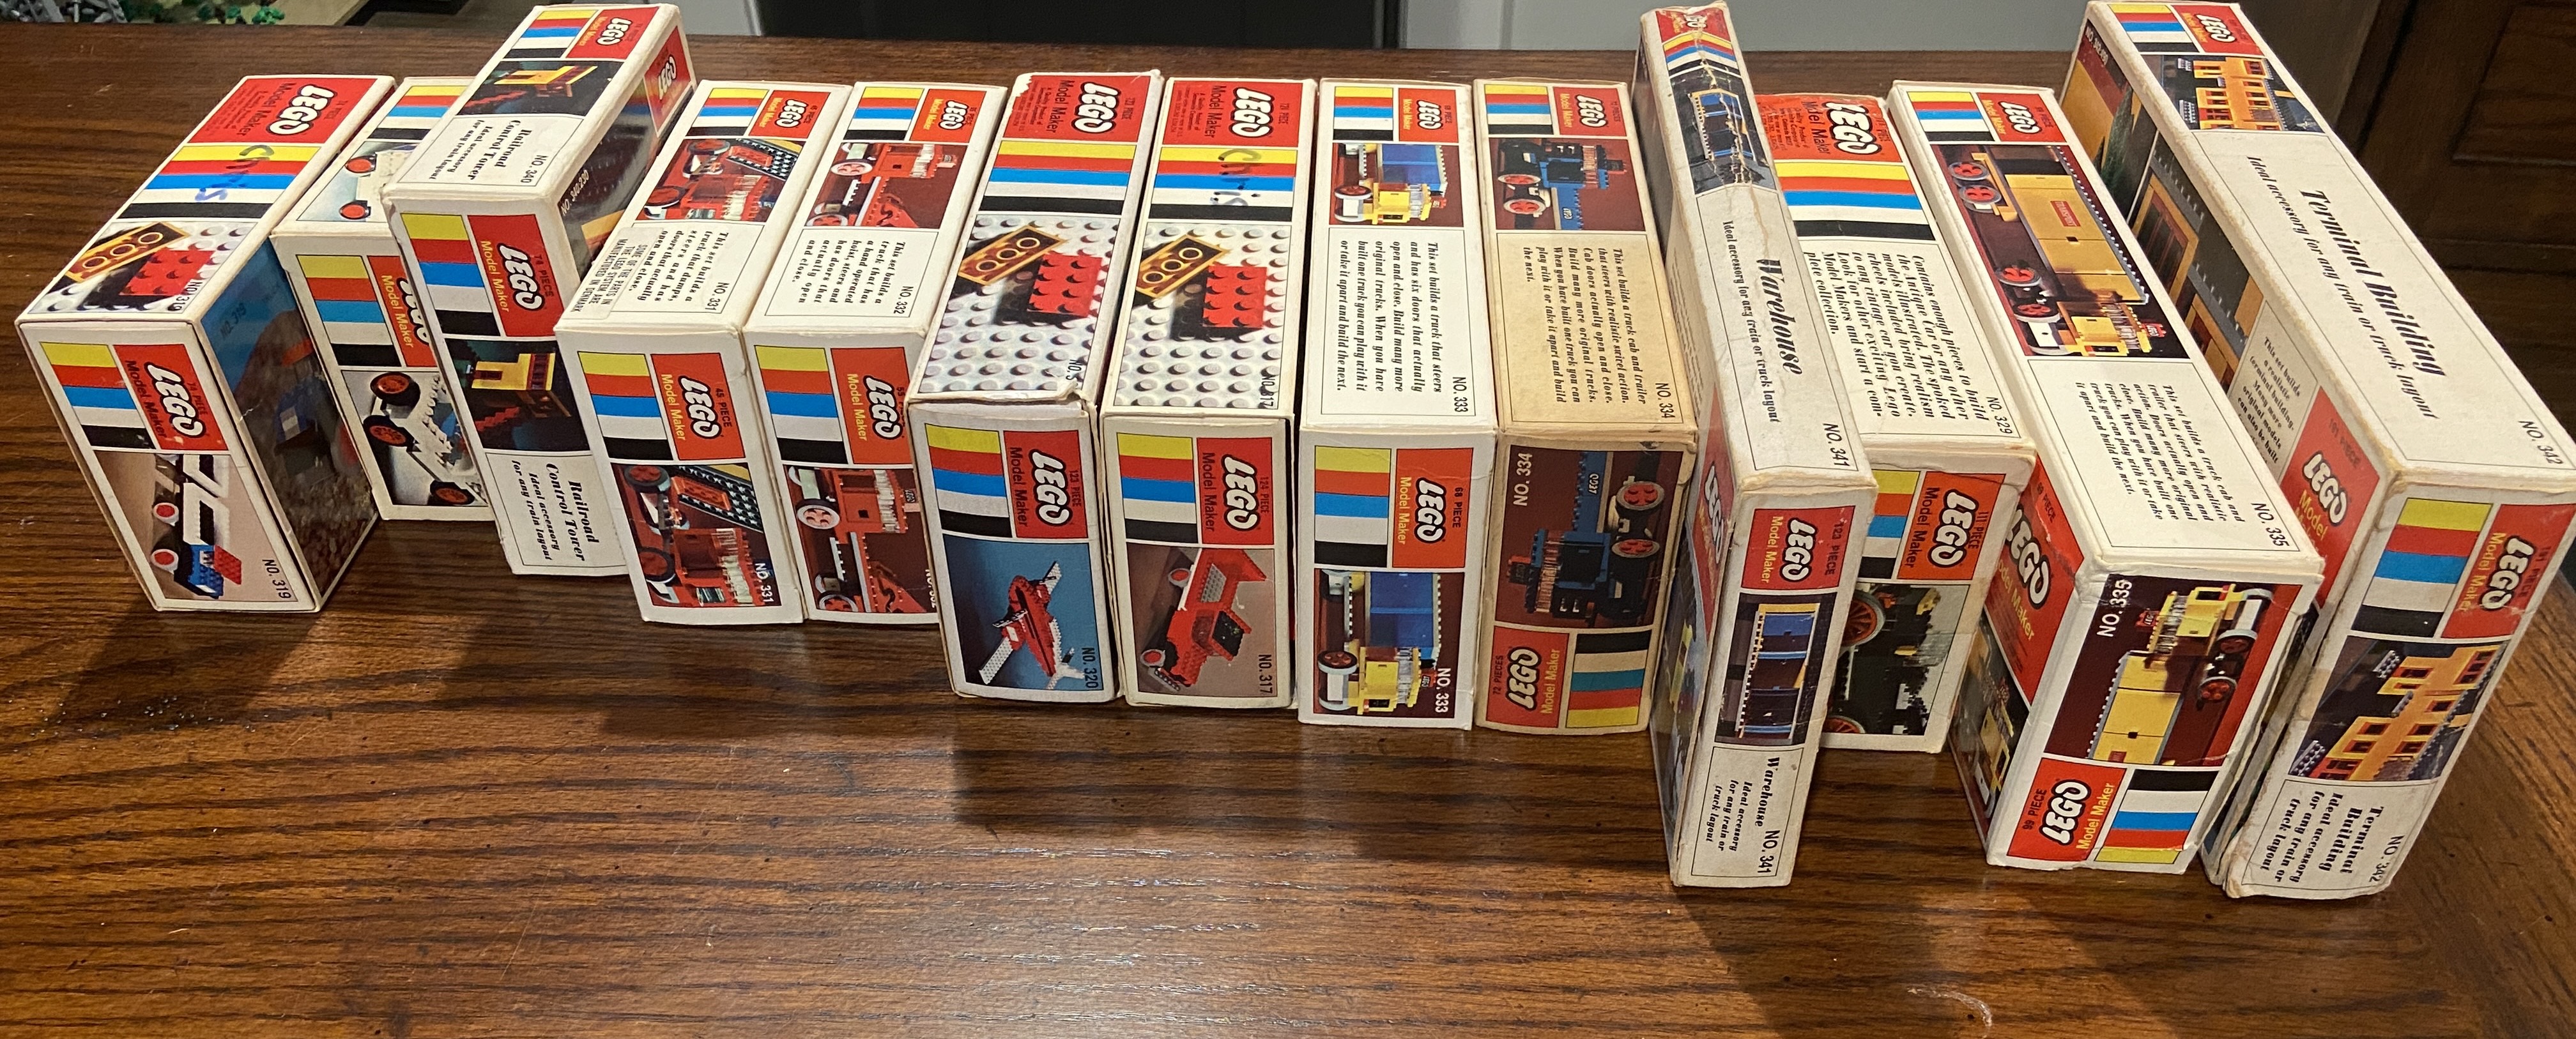
So the immediate thought is to think it's related to box size/piece count. But the outliers pictured here are confusing. Why is the 319 set at the beginning? Why are sets like the 333:390 Delivery Truck, with 68 pieces, above the 317:270 Truck, which has 124 pieces?
It's not related to weight, as the 341:340 Warehouse weighs much more than the 329:360 Antique Car. The numbers cannot be Samsonite's own unique identifier system either, as two of the numbers repeat: 320:270 Two-Engine Plane & 317:270 Truck and 334:340 Semi-Trailer Truck & 341:340 Warehouse. Check it out:
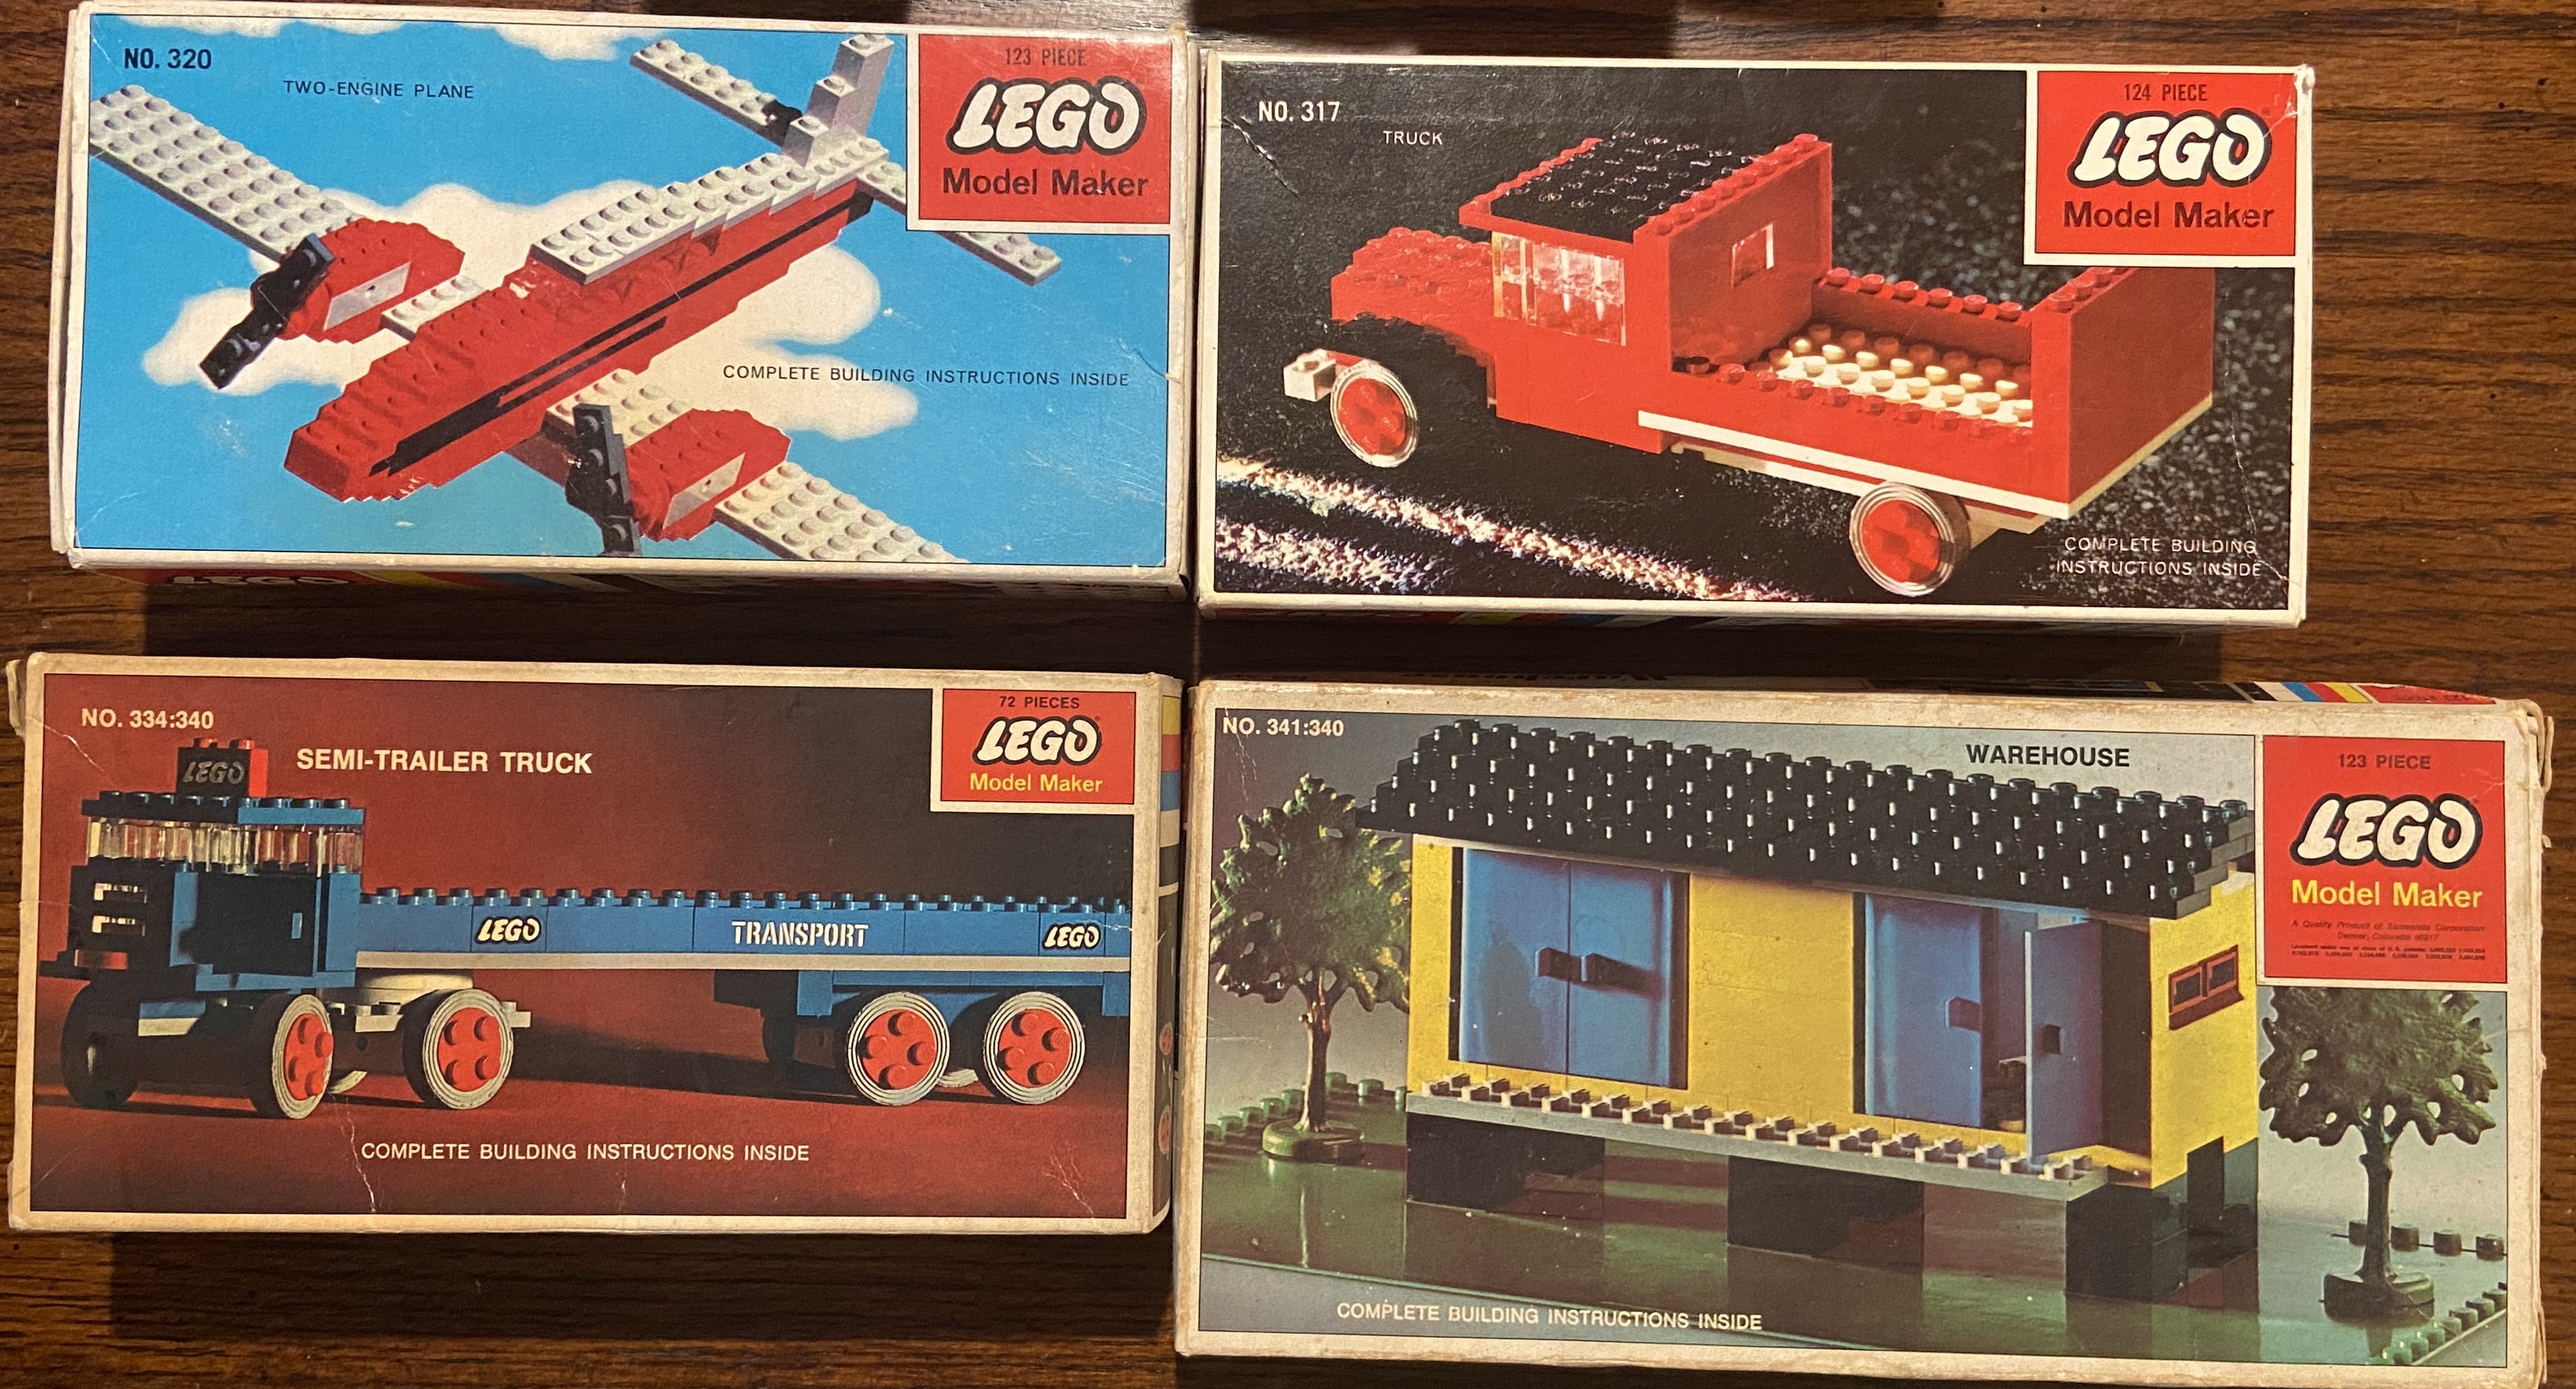
That example was especially confusing for me as I thought about it: the Warehouse has close to double the number of pieces in the Semi-Trailer Truck and yet they share the same alternate number. And another thing with the 319:200 Truck with Trailer, why is it slightly lower than the 330:210 Jeep? Hm.
It's not related to themes, as the railroad accessory sets are strewn about. It could be pricing, but unfortunately individual prices of many of these sets are widely varied, hard to track down, and most sources do not usually list more than a couple at a time, making it really hard to gauge relative prices fairly.
What's interesting to me is that, if we assume this to be a scale related to size/pieces, the 1967 drawer sets seem to be assigned much lower alternative numbers than would be expected. Same with the railroad accessory sets. Even more intriguing, however, is that those are the sets that are missing the "SOME OF THE PARTS IN THE LEGO SYSTEM ARE MANUFACTURED IN DENMARK" sticker.
Maybe it is a scale, but it's not related to a simple number like piece count or weight, as those are easily quantifiable and wouldn't need the implementation of a separate system. Rather, I think we're onto something—it's a scale of complexity/manufacturing logistics.
Take for example all the sets with steering gears and specific car accessories that did not exist in North America prior to 1968:
If sets like the Railroad Control Tower or the Truck With Trailer didn't need parts imported, but sets like the Tow Truck and Dump Truck did, that'd explain why they have higher scores. So maybe it's related to specialty pieces?
That's a neat idea, but it would take an immense effort to outline exactly how all that would work on paper, and we might still be incorrect. I wanted to know for certain, so the plan was thus:
Inventory a few of the smaller sets. Don't worry about colors, just individual lots of pieces. For example, 7 1x2 bricks, 8 1x6 bricks, etc.
Then we need a system that will take that inventory and find the total calculated value for that set depending on the inventory. What will that value be based on, you may ask?
In this system, we will take each brick/plate/window in a particular set and, depending on its size, output a weight appropriate to its size. So for example, for each 2x4 brick we'd multiply two times four and add eight to our total. For each 2x4 plate we'd do the same but divide eight by three, as a plate is 1/3 the height of a brick.
For specialty pieces, we will have to guess their weights. It's not a blind process, as we will not assign values arbitrarily or unfairly but instead by the relative size/complexity of the piece as compared to a normal brick or plate. It's speculative, but it's just a reality of the process.
I prototyped that all up with a python script and this was our first output:
Truck with Trailer(319:200): 215.5
Jeep(330:210): 124.0
Railroad Control Tower(340:230): 185.5
Dump Truck(331:240): 196.0
Tow Truck(332:260): 188.5
Two-Engine Plane(320:270): 377.5
Truck(317:270): 359.0
Delivery Truck(333:290): 256.0
Semi-Trailer Truck(334:340): 257.0
Not great, not terrible. Interestingly, the older 1967 sets were generally scoring higher than the 1968 sets, mainly due to bricks/plates having significant weight.
With some tweaks to specialty piece weights, I continued to refine the model. Generally, I avoided changing anything simply to fit the alternative number, as that would obviously lead to bias and make our model useless. Instead, if there was a logic that could justify a weight being increased I did so, such as the unique spoked wheels for the Jeep and Antique Car having to be imported(I don't know that that happened, but it does not seem Samsonite had those molds prior to 1968).
The big improvement came from thinking about set inventories. It's generally unfair to weigh twenty of the same part as individuals all with the same value, so I implemented a value decay—that is, the first part is 100% of its assigned weight and each subsequent part is worth 85% of that last value.
When running it after all those adjustments, even with some flaws in the code, this is what we ended up with:
Truck with Trailer(319:200): 244.1
Jeep(330:210): 139.3
Railroad Control Tower(340:230): 203.0
Dump Truck(331:240): 192.7
Tow Truck(332:260): 235.3
Two-Engine Plane(320:270): 290.7
Truck(317:270): 352.8
Delivery Truck(333:290): 298.6
Semi-Trailer Truck(334:340): 334.6
The numbers are generally a lot closer!
That doesn't mean we're done. Another improvement was to account for duplicate pieces in multiple colors. It wouldn't make sense to not account for color(I initially omitted considering it as it was faster to manually write out the set inventory), after all five red 2x4s should not weigh the same as five 2x4s in five different colors.
The output of that run was the closest my model came to the numbers yet. I added some additional sets, and after fixing some errors related to plates/baseplates, the calculated numbers were surprisingly close to the originals:
Truck with Trailer 319:200 = 203.6
Jeep 330:210 = 171.6
Railroad Control Tower 340:230 = 169.1
Dump Truck 331:240 = 232.8
Tow Truck 332:260 = 228.7
Two Engine Plane 320:270 = 259.1
Truck 317:270 = 314.0
Delivery Truck 333:290 = 334.1
Semi-Trailer Truck 334:340 = 341.4
Warehouse 341:340 = 356.7
Antique Car 329:360 = 336.0
Transport Truck 335:400 = 421.5
Terminal Building 342:490 = 495.2
I calculated the Pearson correlation coefficient(it measures the correlation between two sets of data) between the original and the calculated numbers. The r-value was 0.954 and p-value was less than 0.00001. Pearson correlations work on a scale of -1 to +1, with anything above 0.7 meaning a strong correlation. Our r-value(0.954) is very close to +1, which indicates the calculated numbers are extremely correlated with the alternative number.
There are of course some sets where the numbers are further off, this is mostly due to my reluctance to adjust weights of specialty pieces to fit the data. I could get those numbers closer by weighing unique pieces higher(take for example the dual-molded car doors, they were only given a weight of 6 each), but that would lead to trying to make the model fit our outcome, Doing so would make the correlation higher but largely invalidate the point of the investigation. We want to know what the numbers mean, not what we can make them mean.
This does not mean our model is useless, however, as when I'd implemented all the changes before that last run, I began to add sets that were not inventoried/present for previous runs. The Terminal Building surprised me the most, as first time it landed within 5 of its assigned number. It's mostly plates and bricks, which means that in that regard we're on the right track.
I've even since found the alternative number for the 316 Tractor and implemented it out of curiosity. It still follows the pattern we found above and now our correlation is even higher:
Tractor 316:160 = 171.3
Pearson correlation: 0.957
P-value: 0.00000009
So with that, I believe we've found the origin of the numbers. Given all that we've determined and calculated, the numbers are most likely an index of sorts that Samsonite introduced in 1968 to track the complexity/manufacturing cost of parts within sets.
I would like to clarify, however, that we've built something far more complex than whatever system Samsonite would've actually used to arrive at these numbers. As they're all rounded to the tens place, its highly unlikely any sort of complex algorithm was used to determine them. Rather, it's much more likely that these were general designations based on a set's contents. The algorithm we created is simply useful to demonstrate this mathematically, not necessarily to recreate it.
Now that we know what they are, an obvious question remains.
Why did Samsonite do this?
Your guess is as good as mine. I've not seen them used/referenced anywhere.
Since the late 1960s was the introduction of sets in Europe being sold to North America, could that have influenced Samsonite in some way to create the scale?
The only explanation I could think of, the only reason that there would be a public-facing mystery alternate number that correlates strongly with the production cost of specific pieces in the set, would be that it was pricing related. As in, the displayed number would just need a decimal to become the retail price. So 270 = $2.70.
But how can we corroborate this? Earlier we pointed out that prices are often very hard to track and evaluate consistently, what could we pull from?
Take for example this 1967 Hawaii dealer cost sheet from brickfetish. This isn't RRP, but instead what it cost for a dealer to order the sets. Unfortunately it's from 1967, so it's missing the entire 1968 line:
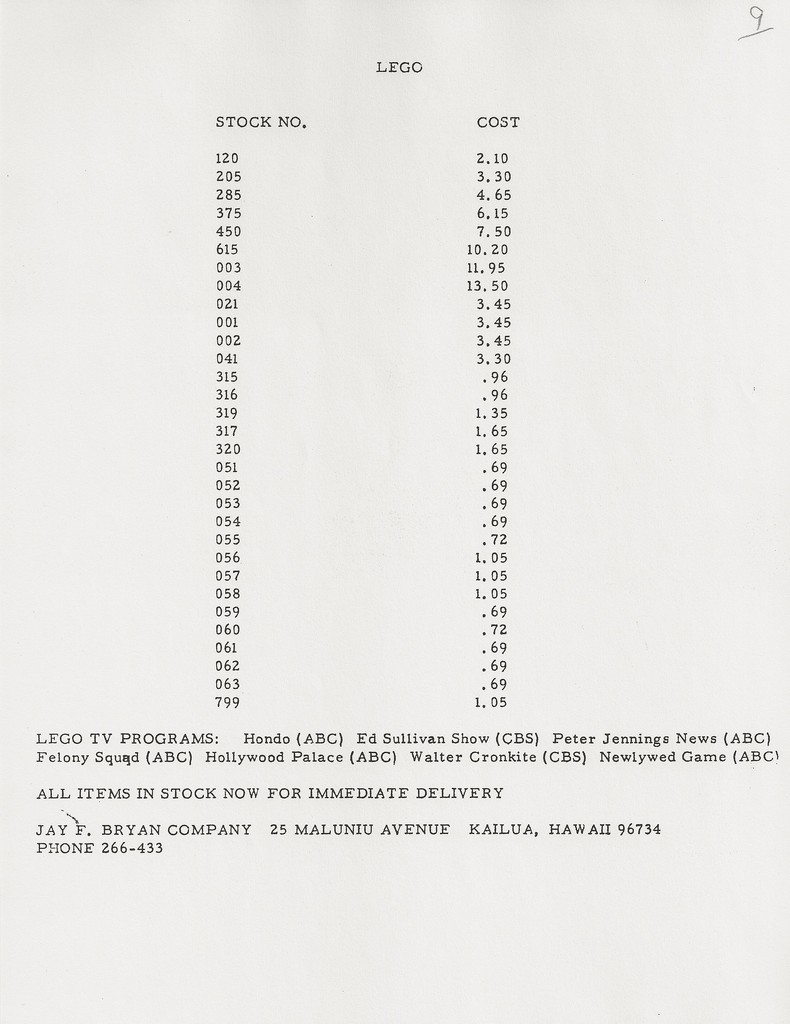
From here, let's list the sets we have alternate numbers for with prices from the above sheet:
316:160 - $0.96
317:270 - $1.65
319:200 - $1.35
320:270 - $1.65
Going along with the hypothesis that the alternate number is related to price, then take the cost divided by the alternate number converted into a price:
316 - 0.96/1.60 = 0.600
317 - 1.65/2.70 = 0.611
319 - 1.35/2.00 = 0.675
320 - 1.65/2.70 = 0.611
That's pretty close—they're all within 60%! Now, is the 319 a bit of an outlier, for sure, but remember these 1967 sets did not release with alternate numbers(as well as costs were different for Hawaii). The fact the percentage is that close between examples tells me we're close if not already there. Also remember that the 317 and 320 shared the same number and in the price sheet above, they share the same cost!
One should note, however, that if we take it that the alternate number is a retail price, the Model Maker sets are almost always seen at a lower price than the alternate number. It could be a Samsonite thing, wherein sales just weren't great and what we see in newspapers are the discounted versions, but who knows.
I'm hoping, having shown that these numbers do have meaning and what specifically they're associated with, is that someone will surface a document or point out a new angle, as I'd really like a resolution here.